Fibonacci versus Kriegeracci
This is a re-post of an article I originally wrote back in 2009 for my old Welcome To the Gutter trading blog which no longer exists. It discusses the JAVA ticker which doesn’t exist anymore, but the lessons are just as relevant today as they were then.
In another article I talked about how most technical indicators are lagging indicators, and some are completely arbitrary with no good rationale behind why they would work. I brought up Fib retracements and how a stock will follow Fib retracements numerous times based on chance alone….indicating a Fib retracement has no inherent value, other than the fact that it may become a self-fulfilling prophecy if many traders are all buying or selling at these retracements.
To futher demonstrate how most Fib retracements are simply chance occurrences, I’ve created my own retracement levels. Let’s call them “Krieger-acci” retracements. Kriegeracci retracements occur at equal levels between 0 and 100% of a stock movement. There are 7 Kriegeracci levels….0, 16.7, 33.3, 50, 66.7, 83.3, and 100.
Let’s take JAVA’s 52-week chart, and show all the Fib retracements beginning from the high of 16.37. I’ve circled the retracements where it approximately hit a Fib level in yellow, and the retracements where it didn’t hit a Fib level in red.
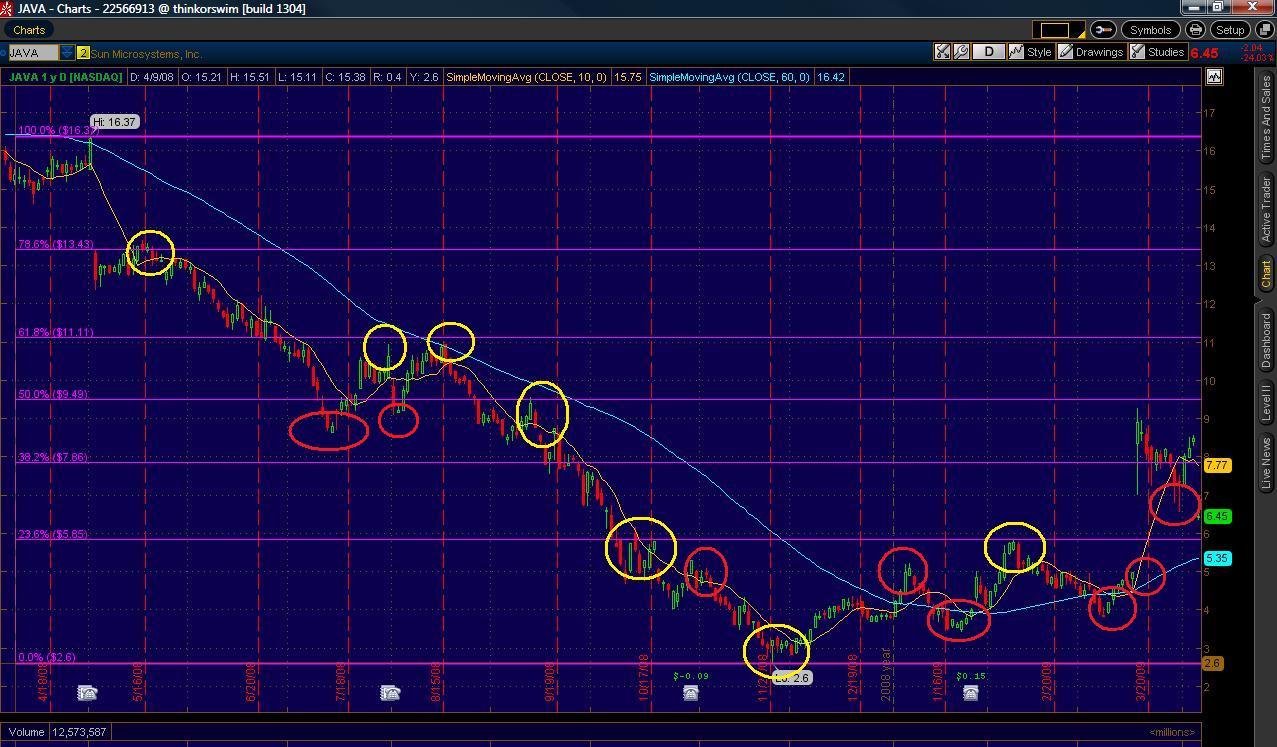
As you can see, the stock bounced off a Fib level (either support or resistance) 7 times and off a non-Fib level 8 times.
Given that the stock bounced off a non-Fib level roughly the same number of times it bounced off a Fib level, that alone should tell you there is nothing significant about Fib levels….stocks hit these levels based on chance alone.
But to further illustrate that Fib levels are completely arbitrary, let’s look at how many times a stock bounced off Kriegeracci levels.
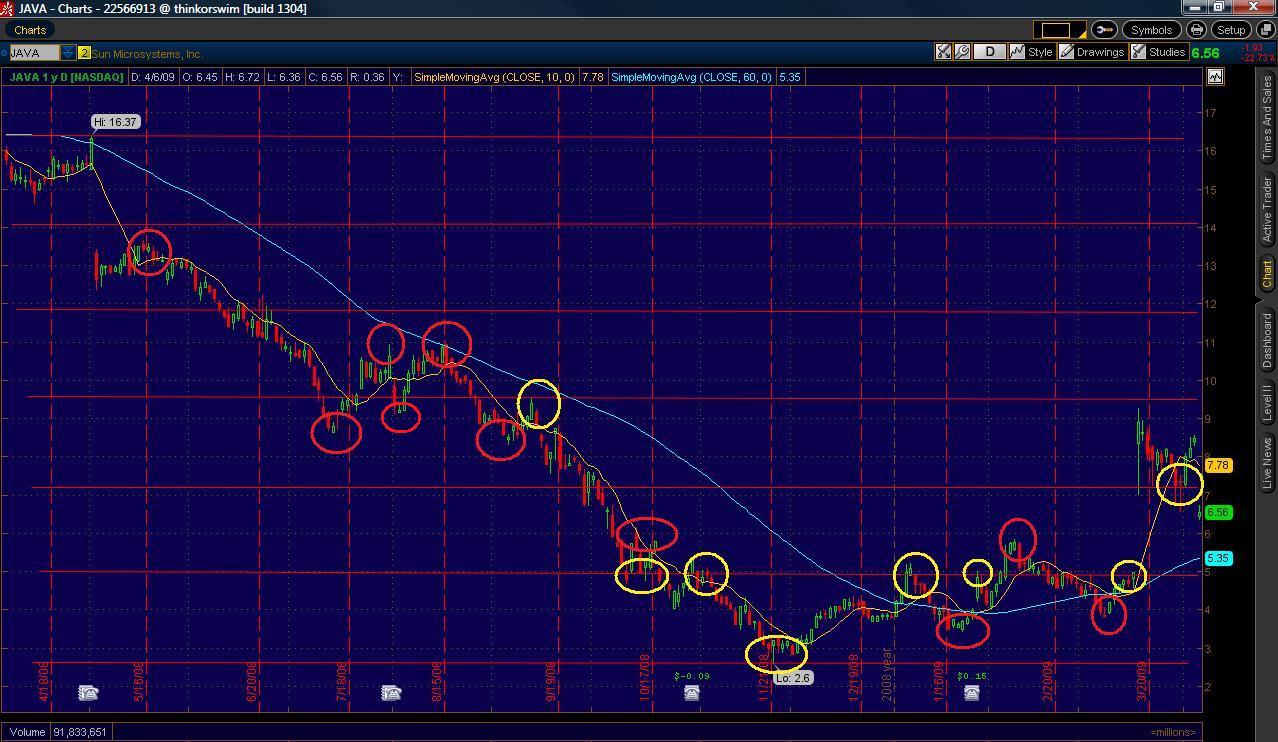
The stock bounced off Kriegeracci levels 8 times and off non-Kriegeracci levels 9 times. Basically, Kriegeracci does just as well as Fibonacci, even though I completely made these levels up.
Basically, any time you divide any stock chart into 6-8 roughly equal sections, like Fibonacci or Kriegeracci, you are going to get the stock bouncing off these levels numerous times due to chance. But it’s also going to bounce the non-levels a roughly equivalent number of times, again due to chance.
Fibonacci only appears to work due to the confirmation bias of the people who use it, and the human tendency to see patterns in randomness and to note the hits but forget the misses. A hard statistical look at Fib indicates that stocks hit these levels no more than chance would dictate.
ADDENDUM 11/18/2020: Adam Grimes did a more formal, extensive statistical analysis of Fib retracements and came to the same conclusion…that Fibs can’t be distinguished from randomness. Check out his posts here and here on this.