Podcast Appearance on Kinfo’s Transparent Traders
Podcast Appearance on The Friendly Bear
The Case for Van Tharp Style Percentage Based Position Sizing
One very important factor in trading is deciding how much size to use on each trade. There are a variety of methods for choosing position size. It could be a flat number of shares (such as 1000), a flat $ amount per trade, or a percentage of your total account size. There are also more advanced methods such as the Kelly Criterion.
However, there are problems with these various methods. If you use a flat number of shares, your position size will dramatically change based on the price of a stock. If you use a flat $ amount per trade, your position size won’t grow as your account size grows. Your percentage gain shrinks with each winning trade. Also, if you go on a losing streak, you’ve got a finite number of trades you can lose on before you lose all your money. For example, if you’ve got $50,000 and you risk $1000 per trade, your money is gone if you get 50 losers in a row (unlikely but you get my point). The percentage loss of your account also goes up with each losing trade…risking $1000 after you’re down to $40K is a bigger percentage riks than risking $1000 when you’ve got $50K.
The Kelly Criterion is popular with some traders, but it requires knowledge of your win probability and win/loss ratio. Unless you’re a systems trader with a well-defined win probability, this can be difficult. Also, use of the Kelly Criterion can result in wild swings in your account, which can be psychologically difficult for some traders. The Kelly Criterion doesn’t leave you a lot of room for error. If you make a bunch of mistakes in a row, you’ll take a big hit to your account. Finally, if there are limits to the scalability with your strategies (like when trading smallcaps), you may run into position size limits fairly quickly when using the Kelly Criterion.
I’m here to make the case that the best method for most traders will be Van Tharp’s position sizing method of using the location of your stop loss in combination with a small percentage-based risk amount. For example, if you have an account of $50,000 and you want to risk 1% per trade, that means you’ll risk losing $500 if a trade hits your stop loss. So if you’ve gone long at $10 and your stop loss is at $9, then your position size will be 500 shares (you’ll lose $500 if the stock hits $9). This is the method I use and is the one my free position size calculator is based on. Let’s talk about the advantages of using this method.
Doesn’t Require Knowledge of Your Win Probability.
Unlike the Kelly Criterion, using a percentage-based risk amount based on your stop loss does not require knowledge of your win probability. Whether your win percentage if 25%, 50%, 75%, or something else is irrelevant…position sizing will always be the same.
Easy to Control The Magnitude of Drawdowns
If you risk 1% of your capital per trade using Van Tharp’s methods, then you know ahead of time how much of a dent a losing streak can cause. For example, you’ll know that 10 losing trades in a row will be approximately 10% of your capital. In fact, it will be a bit less than that (ignoring fees and slippage of course), since your capital shrinks with each loss. In other words, after a 1% loss, you’ve got 99% of your capital remaining. After another 1% loss, you’ve got 99% of that 99%. After 10 losing trades, you’ll have approximately 90.4% of your original capital. Of course, that’s nitpicking, and you can just go with the quick and dirty method of a 10% loss.
With this knowledge, you can determine what type of drawdown you can tolerate, and how many losing trades you would need in a row to get to that drawdown. Personally I risk 2% of my capital per trade. The most losers in a row I’ve had is 8 losers in a row, which is an approximately 16% drawdown, which is a decent size drawdown. Thus, 2% is my max I am willing to do…I won’t do more because a losing streak will put too much of a dent into my capital. For example, if I risked 3% of my capital, then I’d lose nearly a quarter of my capital if I had 8 losers in a row. And you should ALWAYS assume that you could go on a losing streak, ESPECIALLY if your trading system has a lower win percentage rate. In fact, the lower your win rate, the longer your potential losing streaks can be.
Position Sizes Scale Up & Down With Account Size, and You’ll Take Advantage of Compounding Returns
You’ll often hear about traders who “size in” when they’ve got good conviction on a trade and/or when they’re trading well. I’m not a fan of this practice because no matter how good your conviction is, you can still lose. And if you keep sizing in while you’re trading well, you could eventually lose and take a chunk out of what you worked so hard to build. However, Van Tharp style position sizing takes care of this problem. If you’re trading well, your position sizes will automatically grow as your account size grows. If you’re using 1% based risk, your position sizes will double when your account size is $100K vs. $50K (you’ll be risking $1K per trade rather than $500). You’ll take advantage of compounding returns.
It’s often said that you should scale down if you’re not trading well. Again, this method takes care of that automatically. If you go on a losing streak and your capital shrinks, your position sizes will automatically shrink with it. So if you’ve got $100K but you’ve taken a bunch of losers in a row and now you’re at $90K, your position sizes will decrease by 10% accordingly.
If You’re Trading Poorly, You’ll Be Buying Yourself Time & Reducing Risk of Ruin
If you risk 1% per trade, you could think that you’d have to have 100 losing trades in a row to lose all your money. However, it’s better than that. Because each trade is a percentage risk, you’ll be constantly “resetting” yourself for 100 losers in a row with each trading loss. That’s because your position size will shrink along with your account size. For example, to truly lose 50% of your capital, you’d have to have approximately 70 losing trades in a row (and not 50) (0.99 to the 70th power). If you had 100 losing trades in a row, you’d still have about 37% of your original capital left (0.99 to the 100th power). Thus, using this form of position sizing buys you time to figure things out if you’re on a losing streak.
Psychologically Easier, Especially When Scaling Up
If you risk 1% of your capital per trade, then you know you’re only risking 1 cent for every dollar. It helps put your risk in perspective. It also makes things psychologically easier as your account size grows. If your account size grows to $500K, it’s easier to think that you’re just risking 1 cent on the dollar for every trade rather than risking $5000 per trade.
Give Van Tharp Percentage Based Position Sizing A Try
It’s a great method for a lot of traders with a lot of advantages. It reduces risk of ruin while simultaneously allowing you to compound your account. Personally I wouldn’t risk more than 1-2% of your capital per trade (I do 2%). Any more than that, and losing streaks can start to put big dents in your capital. If you want to be able to quickly estimate your position sizes while trading, try out my free position size calculator.
Prepare, Perform, Profit!
You Better Pay Yo’Self Before You Slay Yo’Self
People get into trading for one obvious goal: to make money, and to do it in a scalable way.
Of course, making that money comes with risk. In trading, you can just as easily lose money as you can make it. And when you look at the stats among day traders, people are more likely to lose money than make it.
Let’s say you’re in the small percentage of traders who can consistently make money. Let’s also say you’re now past the account-building stage. Your trading accounts have grown to the point where you could take some money out and still have money left over to trade with.
So do you do it?
YES.
And not only should you do it, but you should do it on a regular basis. I know it can be tempting to leave all your money in there, and continue to let it compound, especially when you’re trading well. But no matter how good things are going, you should always be taking some money out of your accounts on a regular basis. Why?
THERE ARE NO GUARANTEES IN TRADING.
Let’s say you’ve been killing it and consistently making money month after month. Just because you’ve been killing it doesn’t mean it will continue. Market conditions could change and your edge could disappear. A previously winning strategy could turn into a losing strategy. Perhaps you make a string of mistakes which causes a drawdown. Or, worse yet, perhaps you size in too much on a trade, it goes against you, and you don’t obey a stop loss and wipe out a big chunk of your account in one trade.
All of these things can happen to even the best traders with years of experience. And if you’re not taking money regularly out of your account, you can lose what you’ve worked so hard to build.
IN TRADING, YOUR CAPITAL IS YOUR LIFEBLOOD.
You need to protect your capital at all times. And that means regularly withdrawing money out of your account and putting it in safer places to protect your capital and protect from the situations I described earlier.
A REAL LIFE EXAMPLE
I am a perfect example of just how important it is to pay yourself on a regular basis.
My first stint as a full time trader started in 2013. By 2014 I was killing it and was one of the top 20 traders on profit.ly at the time. At first I was regularly withdrawing money from my trading accounts. But then I got greedy. I thought, “I’m making better percentage returns on this money than I would any other place! I’m going to leave it in there.” So I stopped regularly paying myself.
That came back to bite me in the ass. I started to take on too much risk, and eventually came a big blowup in October of 2014 where I lost over 50% of my capital in one day due to poor planning and poor risk management when trying to short the body-cam craze-related stocks LAKE and APT. While I still had capital to trade with, it had decreased so much that it was psychologically devastating, and I wasn’t able to recover. I had given up my other sources of income, and was now under too much pressure to make money from trading. My accounts kept bleeding and by the end of 2015 I had to give it up until I was able to begin again in 2018.
Now, if I had continued to regularly pay myself and put some of that money into safer investments or into savings, I could’ve easily replenished my trading capital. But instead I had to restart my Weightology business from scratch, and it took 3 years for me to get my income high enough to where I could restart some small trading accounts.
REAL LIFE EXAMPLE #2
I’ve now come back better than ever. I’ve been profitable for 4 straight years, and make enough money to where trading is now my primary source of income (this time though I have been smart enough not to give up my other income sources like Weightology). I’m one of the top ranked all-time traders on Kinfo. Like 2013-2014, I’m a full-time trader, but much smarter. I now trade through an entity. This allows me to generate earned income from my trading and make retirement contributions from it. I treat trading just like a regular W-2 job. I pay myself a paycheck every 2 weeks, running it through a payroll provider. Thus, I’m withdrawing money from my trading accounts twice per month. I withdraw 5% at each paycheck, and thus am withdrawing 10% of my trading accounts on a monthly basis.
The interesting thing is that this year, the habit of regularly paying myself has saved me from being in the red. This year has been fairly slow for me in terms of absolute profits. This is mainly due to working on a variety of new strategies to make myself a more rounded trader. Thus, I’ve taken a lot of lumps as I develop those strategies. My best strategies are trading big gappers, which was instrumental in my outstanding year in 2021. However, good gappers have been few and far between this year, and thus haven’t been able to make up for the lumps and losing streaks I’ve taken while working on other strategies. I’ve locked in around 20-25R in realized profits this year. However, if I had left all the money in my accounts and never withdrew, I’d be down 11% this year!
So how can that be? How can I be up in absolute profits but down in relative percentage terms (adjusted for withdrawals)? It’s because I regularly withdraw money from my accounts. My accounts were much larger earlier in the year, and thus my absolute profits were bigger. As I kept withdrawing from the accounts, when I went on losing streaks, my accounts would dramatically shrink. Since I always set risk as a small percentage of capital, the absolute amount of money I risk goes down as my account size goes down. Thus, even if I go on losing streaks, the amount I lose isn’t enough to overtake the larger absolute profits I withdrew earlier in the year.
If I hadn’t been paying myself on a regular basis, I would have lost money so far this year.
PAY YO’SELF BEFORE YOU SLAY YO’SELF
The lesson here is that you should always be paying yourself as a trader once you’re past the account building stage. In fact, even a trader who is in the account building stage would be wise to take small amounts out…small enough to allow for account building but large enough to protect some profits. I like using percentage-based amounts, and thus the amounts you take out can scale up and down with your account size.
Prepare, perform, profit!
The Case for Longer Time Frames for Day Traders
Ahhh, the 1 minute chart…probably the most popular time frame among day traders.
But what if I told you that you might benefit from switching to a higher time frame?
In fact, I’m here to make the case that you might want to ditch 1 minute charts altogether. I no longer use 1 minute charts in my trading. I’m going to outline all the pros of using higher time frames, along with some of the cons. Obviously whether you use 1 minute charts or not will depend on a few factors (like whether you’re a scalper or not), but I hope to show you that, at the very least, including longer time frames into your charts can be very useful. So, let’s get to all the pros of using longer time frames.
THE PROS
1. Less Fakeouts
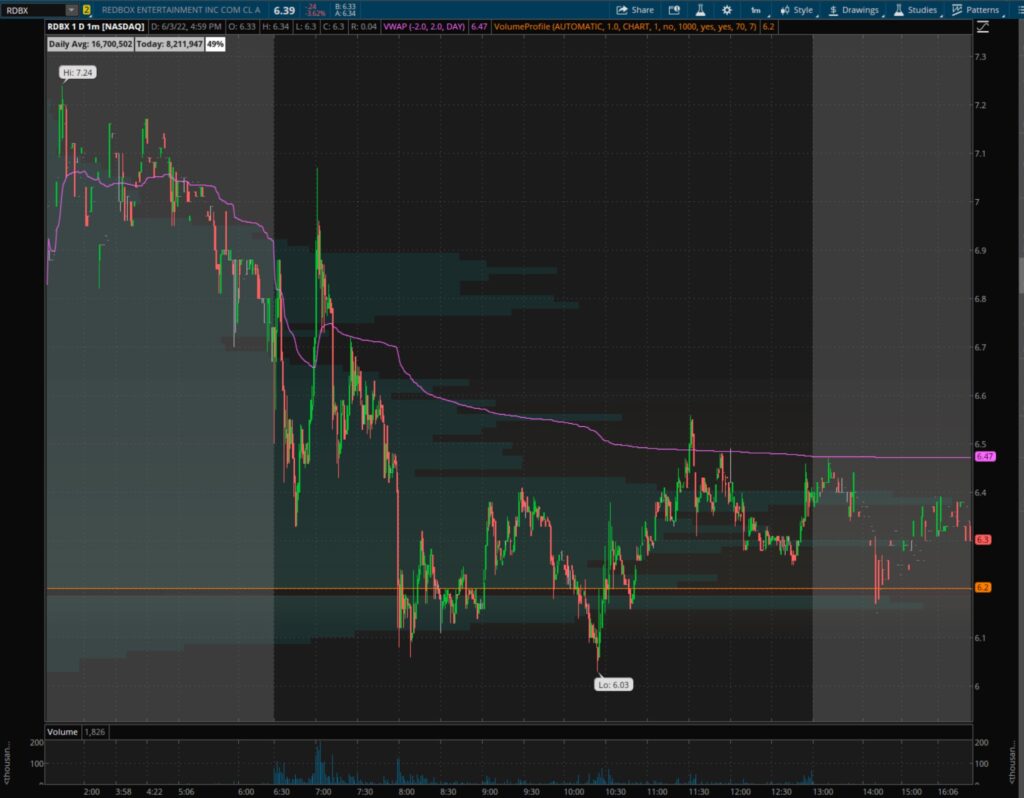
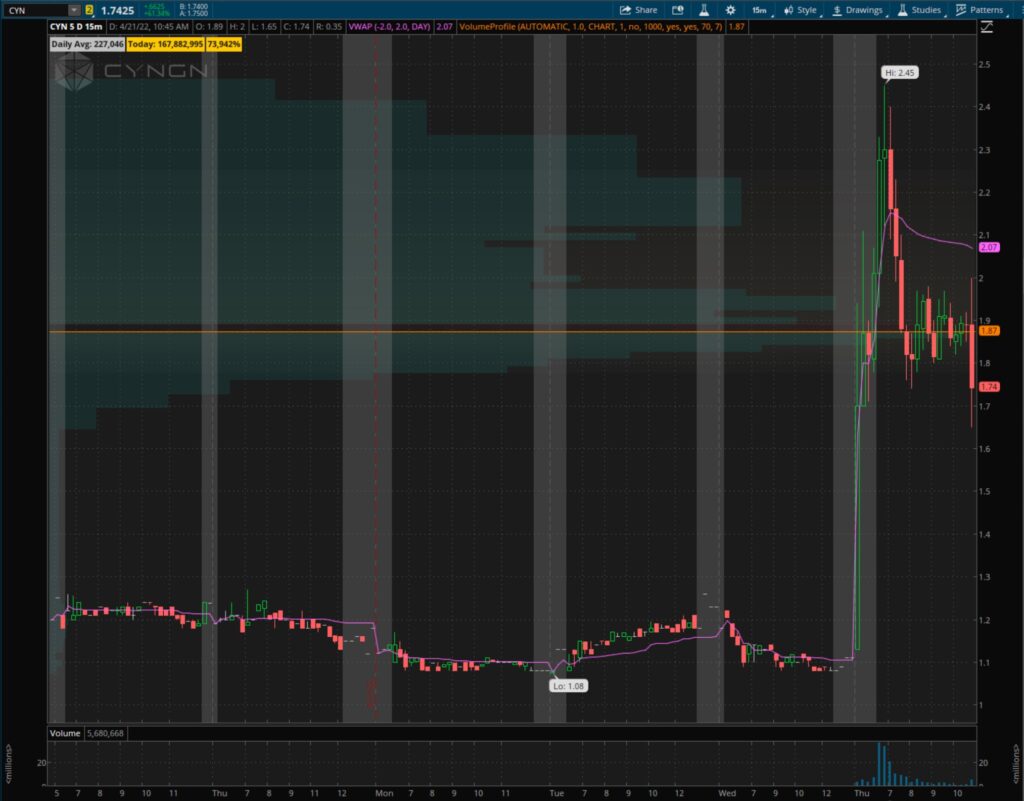
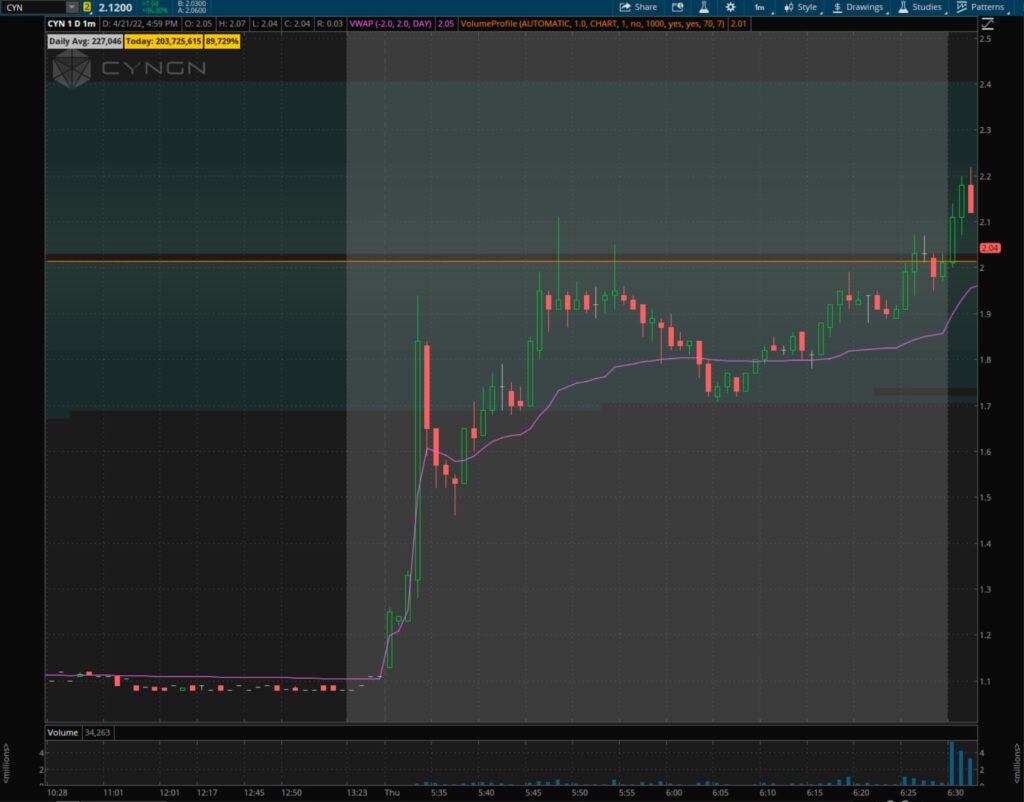
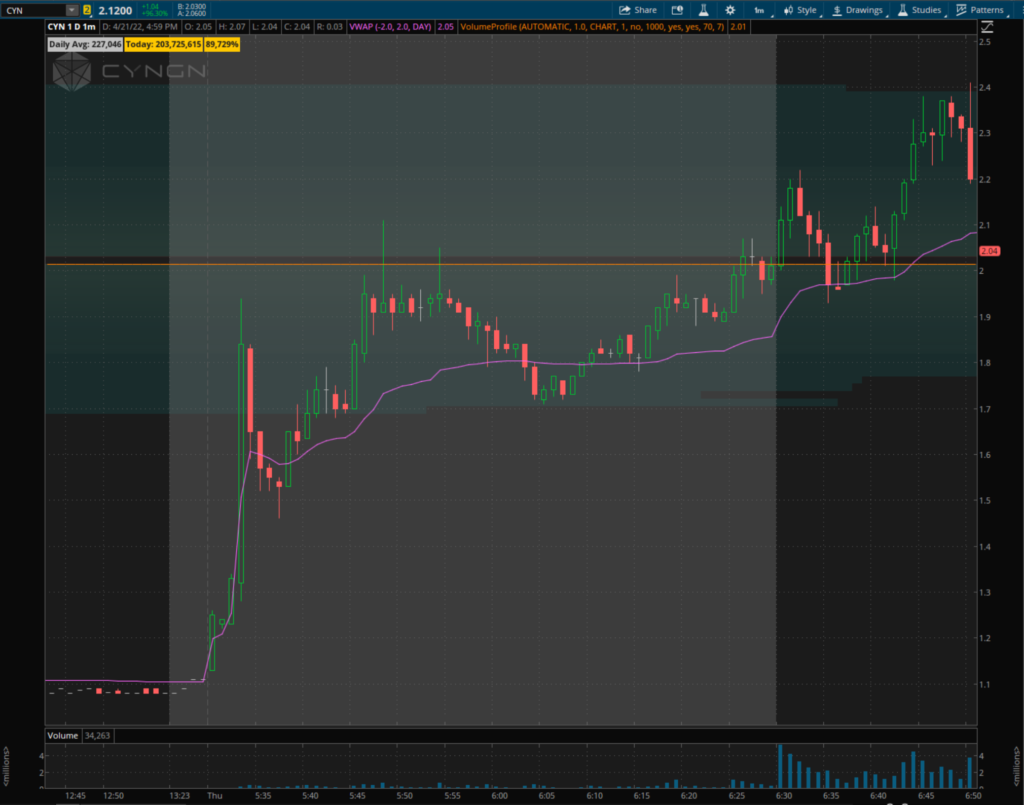
There’s a lot of noise with intraday trading. There’s also a lot of fakeouts where a stock will start to move in one direction, only to reverse and go the other. If you’re using a short 1 minute time frame, it’s very easy to get faked out and caught on the wrong side of a trade. Let’s take CYN as an example from April 21, 2022. Here’s the 1 minute chart at 13:50 EST.
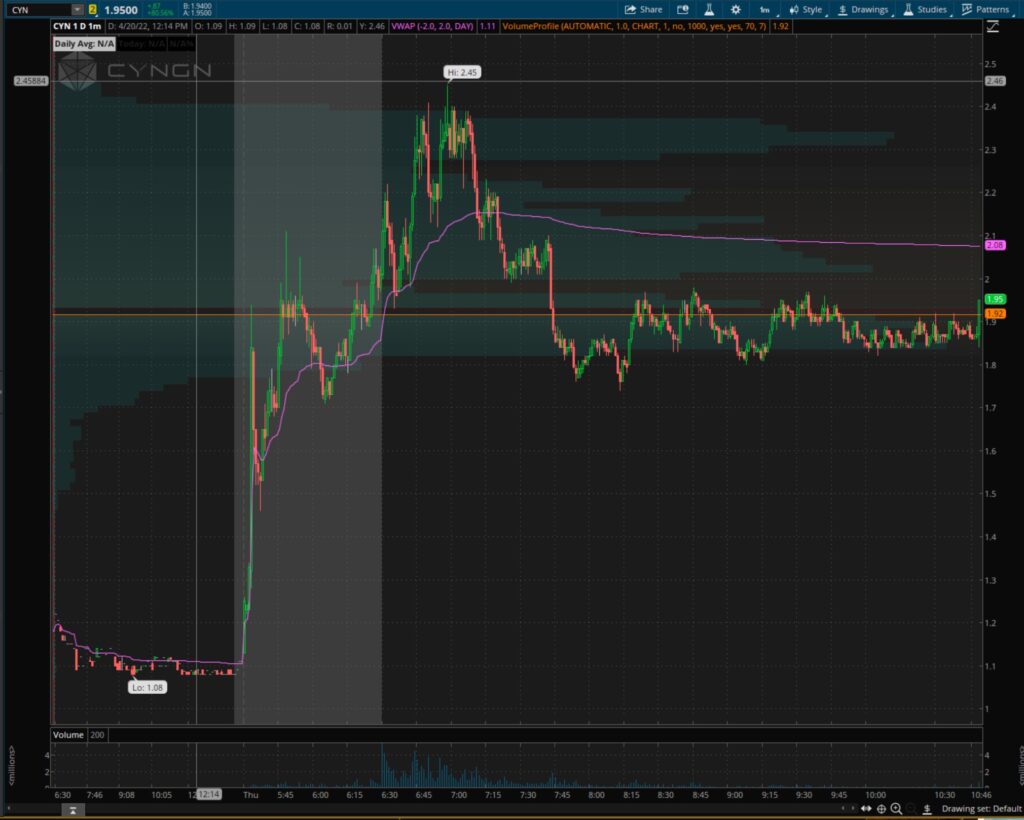
If you’re focused on the 1 minute chart, you’ll notice the nice base in the mid 1.80’s. Plus, it was a heavily shorted stock as it had gapped up quite a bit, and it was starting to break with volume off of the base. You might jump in and go long, or quickly cover your short if you were short. But let’s look at what happened one minute later.
HUGE STUFF. The stock touched 2 with volume, only to suddenly experience a rug pull. If you had longed, you’d now be buried. If you had covered your short, you’d now be pissed.
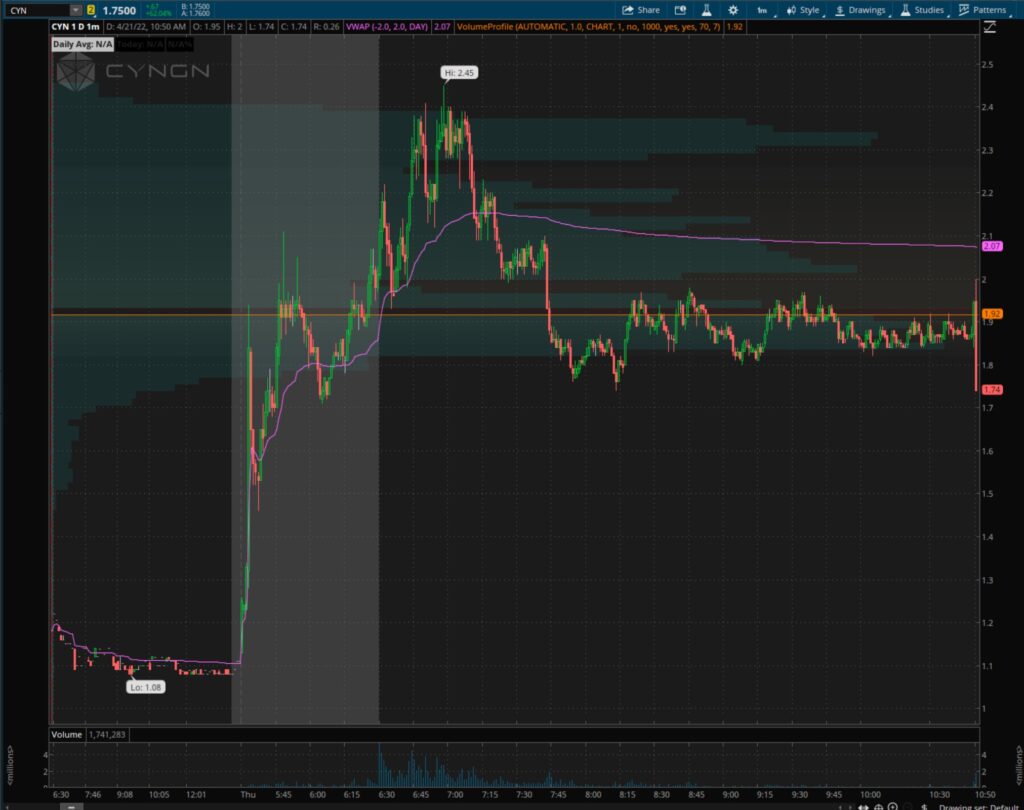
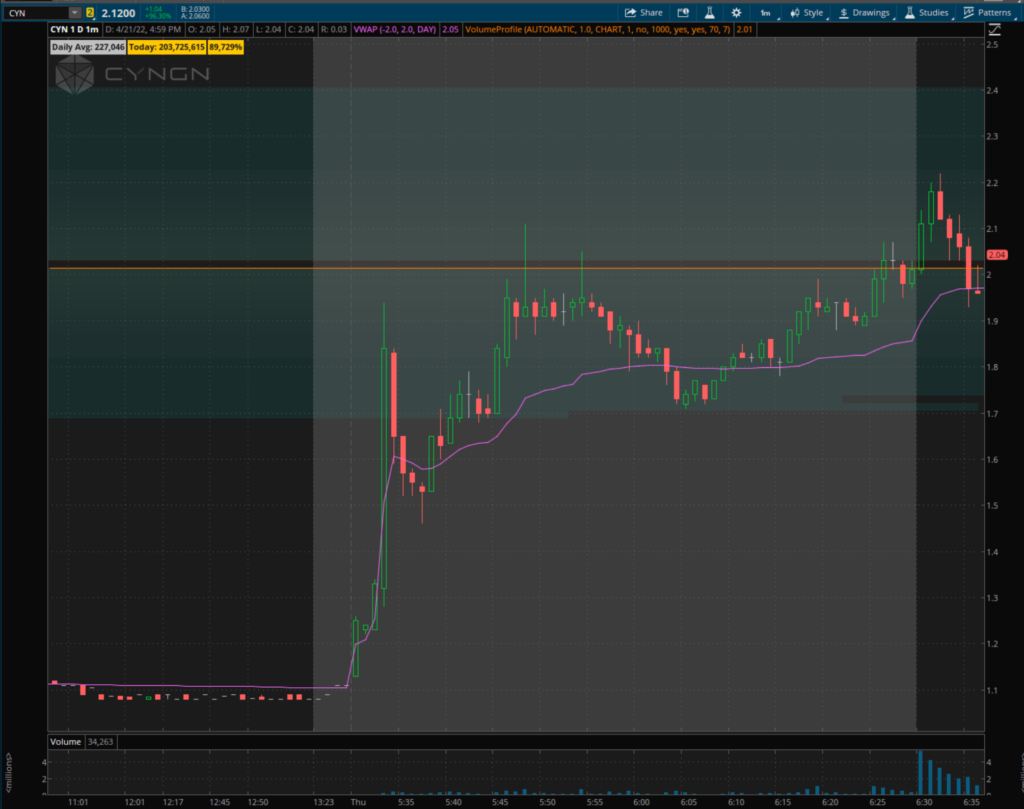
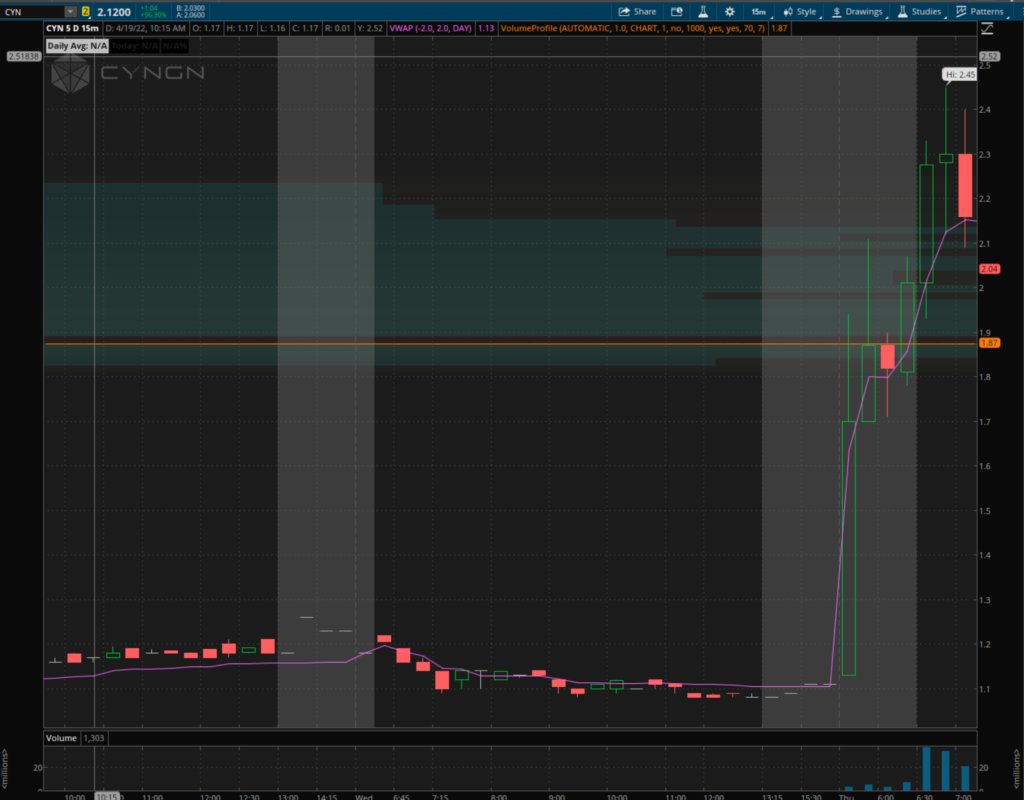
But what if you had used a longer time frame, and waited until the close of a candle before you decided to make any trading decision? Here’s what the 15 minute chart looks like. If you had used a 15 minute chart, and decided to wait for the close of a 15 minute candle before making a trading decision, you would’ve avoided getting faked out.
2. Less Trades and Less Chance of Losing Streaks/Big Drawdowns
If you use longer time frames and wait for the close of candles before you make trading decisions, you’re automatically in a situation where you’ll make less trades. On a 1 minute chart, there are 390 candles during the regular trading hours. On a 5 minute chart, there are 78 candles. On a 15 minute chart, there are 26 candles. Thus, you’ll make less trades using higher time frames. This means you have a lower chance of multiple losing trades in a row, and a lower chance of big drawdowns.
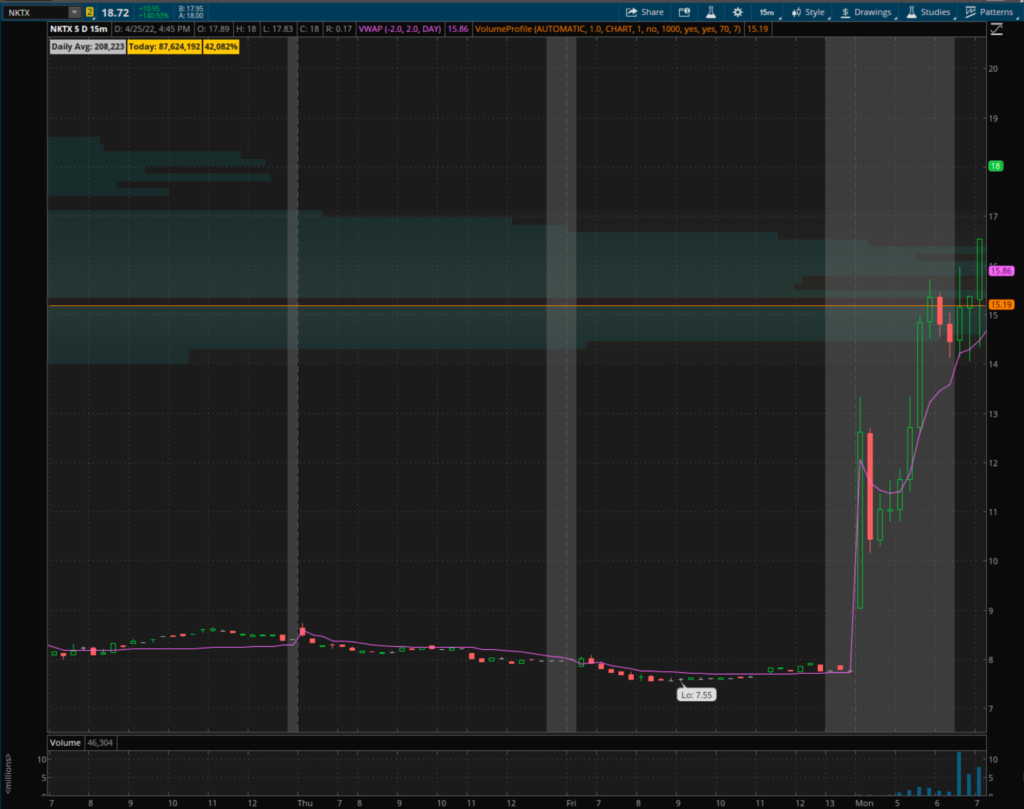
Let’s use NKTX as an example from April 25, 2022. If you’re using the 5 minute chart, you might be tempted to short 5 minutes out of the open when you see the failed move above premarket highs and how longs got stuffed out of the open.
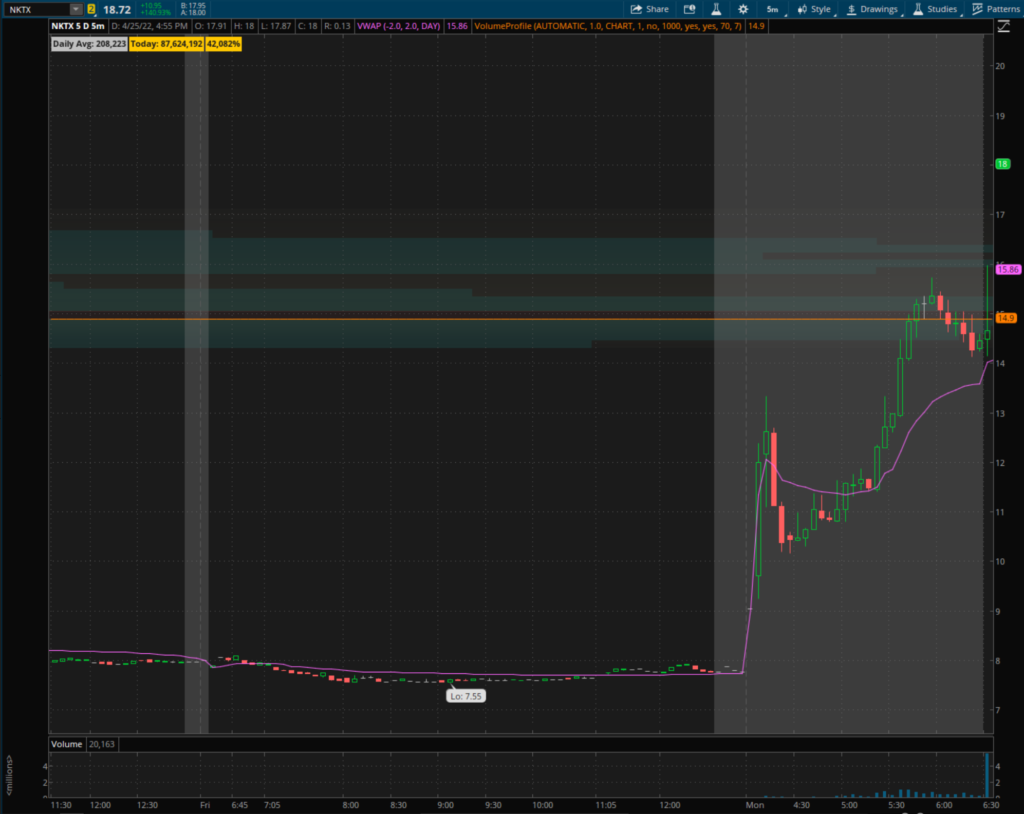
After repeated failures/stuffs of $15, you might even add to your short or kept trying to short multiple times.
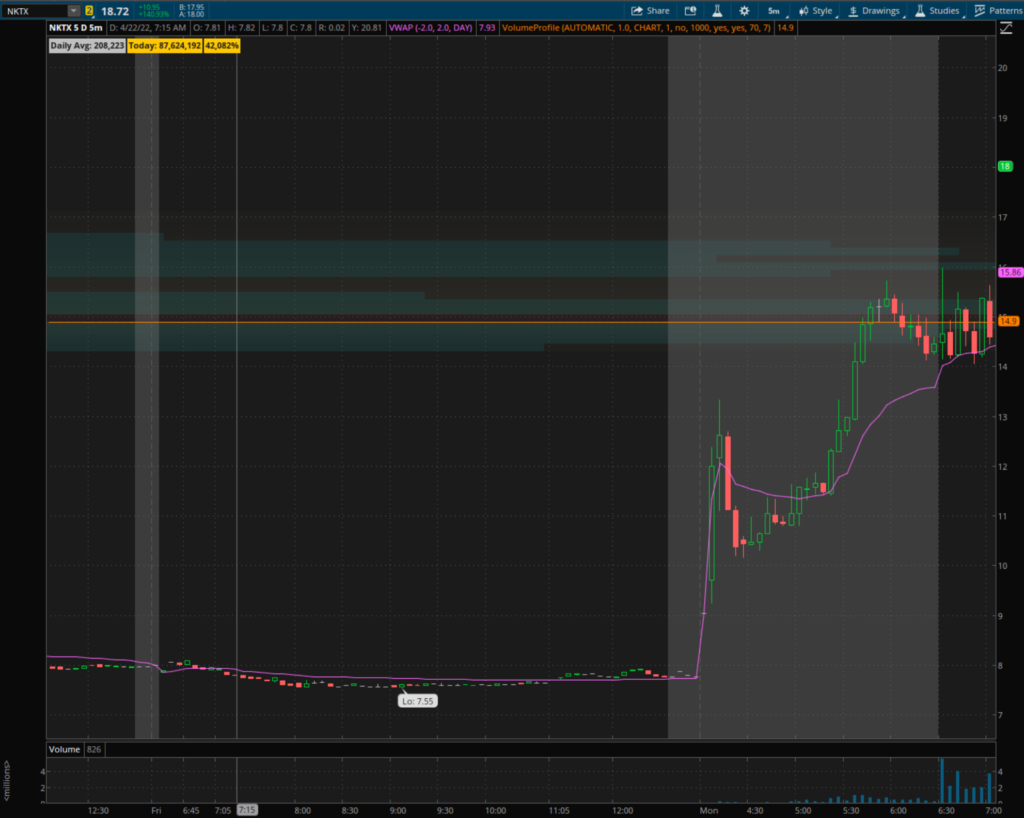
But then the stock bases and breaks to new highs, and you take a loss (or perhaps even multiple losses if you kept trying to short every $15 stuff move).
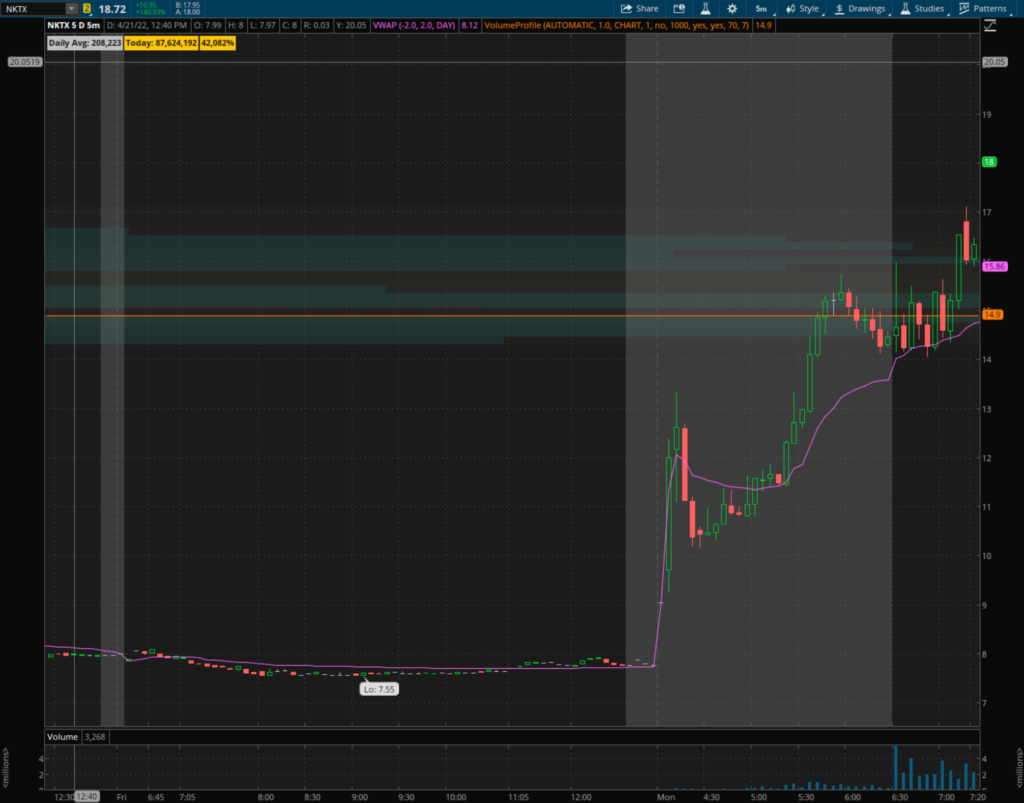
But what if you had used a 15 minute chart and waited for the close of each candle? You would’ve avoided multiple losses…in fact you would’ve avoided the short altogether.
Less trades also means less commissions.
3. It Forces You to Be Patient
By forcing yourself to wait until the close of a candle on a longer time frame, it forces you to be patient and wait for the right setups. It can be very useful if you find yourself with an itchy trigger finger and you’re entering trades prematurely. You’ll be more likely to stay out of bad trades. It can also help you from being too early, especially on the short side, where short squeezes are often the result of shorts being too aggressive or too early on their shorts.
Let’s again look at CYN from April 21, 2022. If you’re using the 1 minute chart, you might be tempted to short 15 minutes after the open when the stock fails $2.20.
Now, if you’re a scalper, you’ll get about a 10-15 cent move here that you can cover into.
But if you’re not a scalper and you like to shoot for bigger moves, you’ll get stopped out.
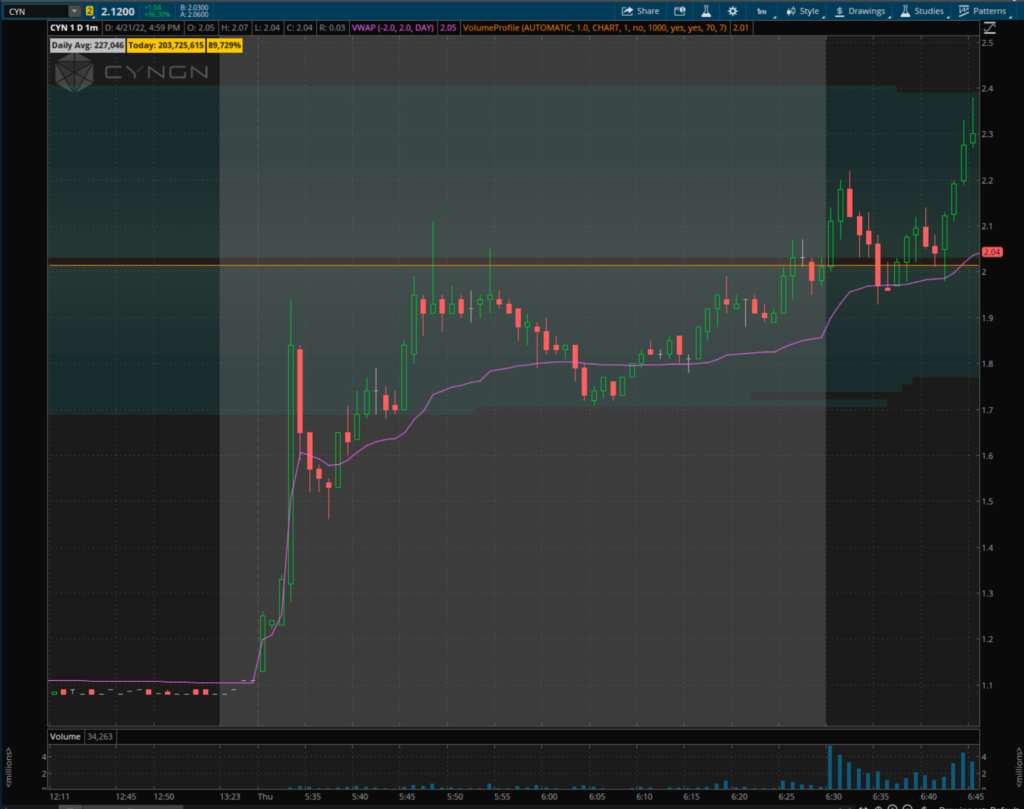
Then you might be tempted to short as soon as 2.40’s get stuffed.
But if you don’t have a wide stop (let’s say you set your stop loss above the high of the stuff move), you’ll get stopped out again.
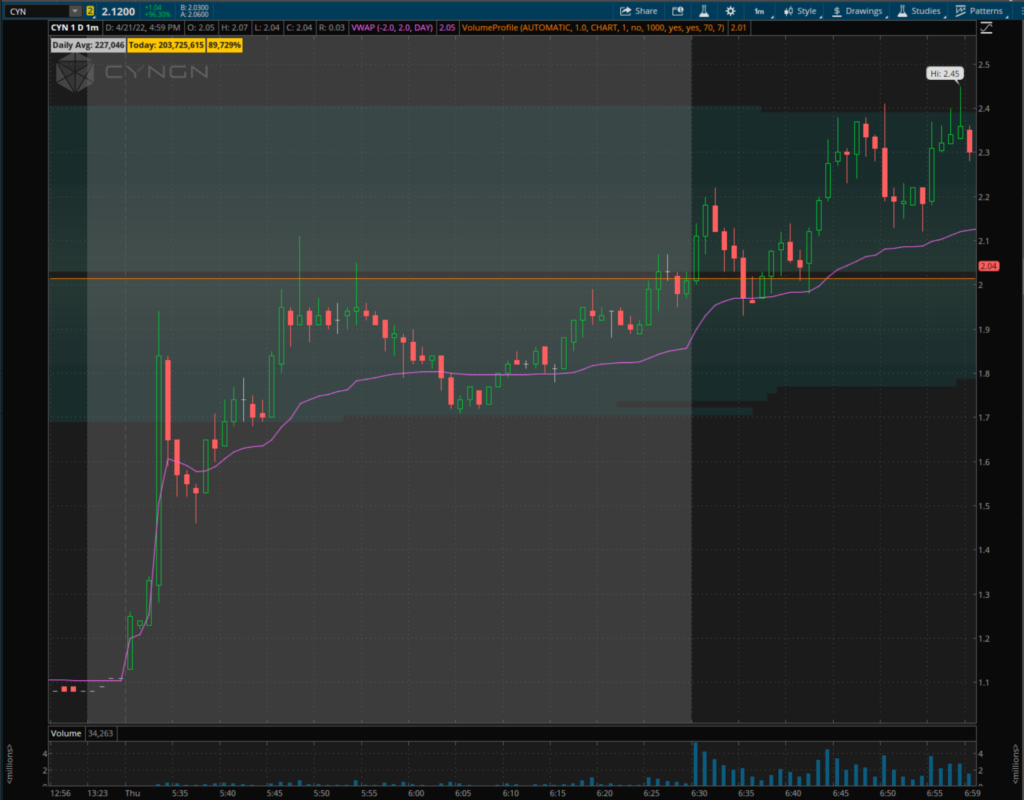
Thus, you’ve got two cases where you were too early on the short (assuming you’re not just trying to scalp). But what if you had used a 15 minute chart instead?
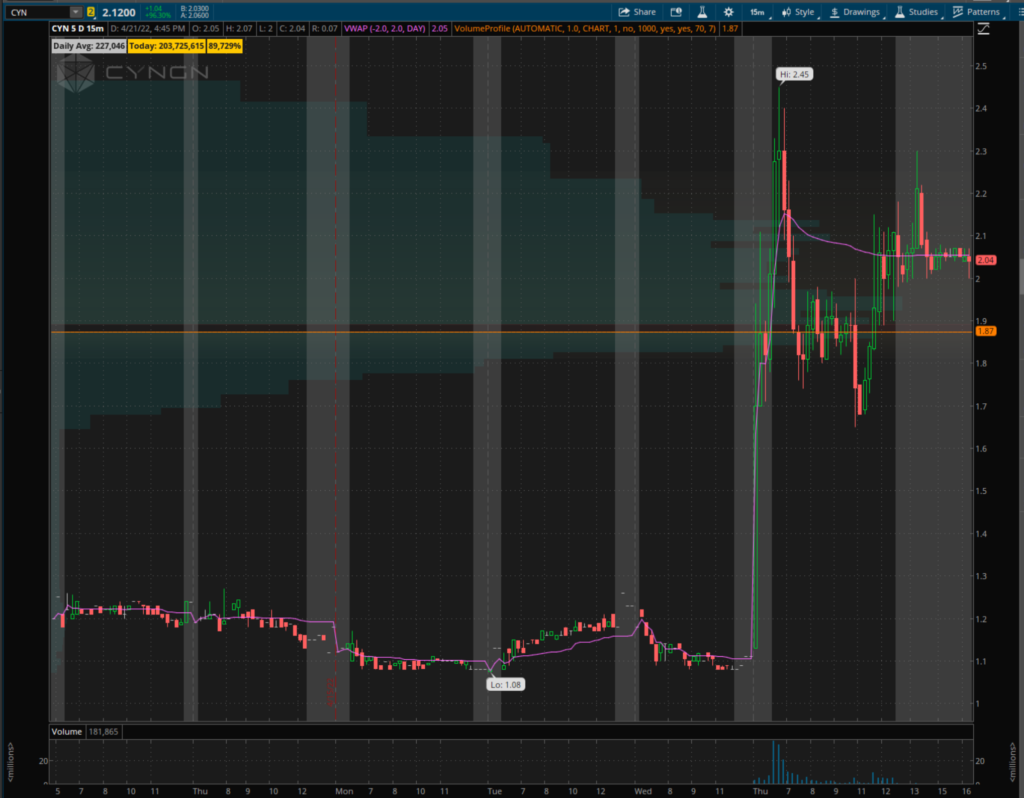
You would’ve avoided the first two shorts, and you would’ve been forced to patient and wait for the 2.40’s to truly top out. Then any short in the 2.10-2.20 range would’ve worked out, because the stock fell all the way to under 1.70.
4. More Time to Carefully Assess Trade Setups/Less Time Focused on Screens/Less Chance of Rushed Decisions
If you force yourself to wait until the close of candles on longer time frames, it gives you more time to assess potential setups. You’ll see things more clearly. You’re less likely to make a rushed decision, and you can even step away from your computer in the middle of time intervals to focus on something else and come back when the close of a time interval is getting close. This can be advantageous for traders who are multitasking with other responsibilities during the trading day. For example, I’m on the west coast and sometimes have to help get my kids ready for school around 7:30 – 8:30 AM PST. Using longer time frames gives me chances to briefly step away from the computer to do this.
5. Allows More Scalability of Size
If you’re using longer time frames, you’ll naturally tend to have wider stops to avoid premature stop-outs due to intraday noise. The advantage of that is that your positions will be more scalable as your account grows. One problem with the smallcap market is that there are limits to scalability of returns. You can’t just keep increasing position size as your account grows. Eventually you’ll be taking on positions that are too large relative to the daily trading volume. This is particularly an issue if you’re a scalper and you’re using smaller time frames. However, if you’re using longer time frames, you can ultimately take bigger positions since your overall size will be smaller relative to the time frame you’re using.
Of course, longer time frames aren’t all pros. Let’s look at some of the cons.
THE CONS
1. You’ll Miss Some Moves
Forcing yourself to wait on longer time frames means you’ll sometimes miss a move. For example, a lot can happen on a 15 minute time frame, and sometimes by waiting you can miss an entry or even entire move. However, I’ve found for me personally it helps me stay out of bad trades more than the moves I sometimes miss, so it’s a net positive for me.
2. You May End Up Being Late on Entries in Some Situations
This is similar to #1. You might not miss a move, but you may not get the best entry when you wait on a longer time frame. That said, I’ve found that missing premature entries/bad trades more than makes up for the occasional lack of ideal entry.
3. Not A Good Method for Scalpers
If you’re someone who likes to scalp small moves, then longer time frames won’t make sense. You’ll miss too many moves using a longer time frame. That said, using longer time frames in conjunction with your 1-2 minute time frames may give you a better big picture of what’s going on and help with your scalping decisions.
4. Harder to Scale in/Scale out of Positions
If you’re a single entry/single stop loss trader, then longer time frames can work. However, if you’re someone who likes to scale into and out of positions, then you may need the smaller time frames to help guide those scales. That said, there’s still an advantage to simultaneously using longer time frames to give you a better big picture of what’s happening with a stock.
Give Longer Time Frames a Try
I no longer use 1 minute charts. I use mostly 15 minute charts, but some 5 minute charts for certain setups. I even use 30 minute charts for a few setups. I find myself trading more patiently by using longer time frames, and it works better for me as I’m someone who likes to hold out for bigger moves where small time frames just don’t make sense. It also works better with my lifestyle given my situation on the West Coast and my kids waking up soon after the market open.
This isn’t to say that longer time frames are best for all traders. You need to figure out what works for you. However, if you’re finding yourself constantly being too early on trades, or misreading a lot of setups, then give longer time frames a try.
My Trading Setup
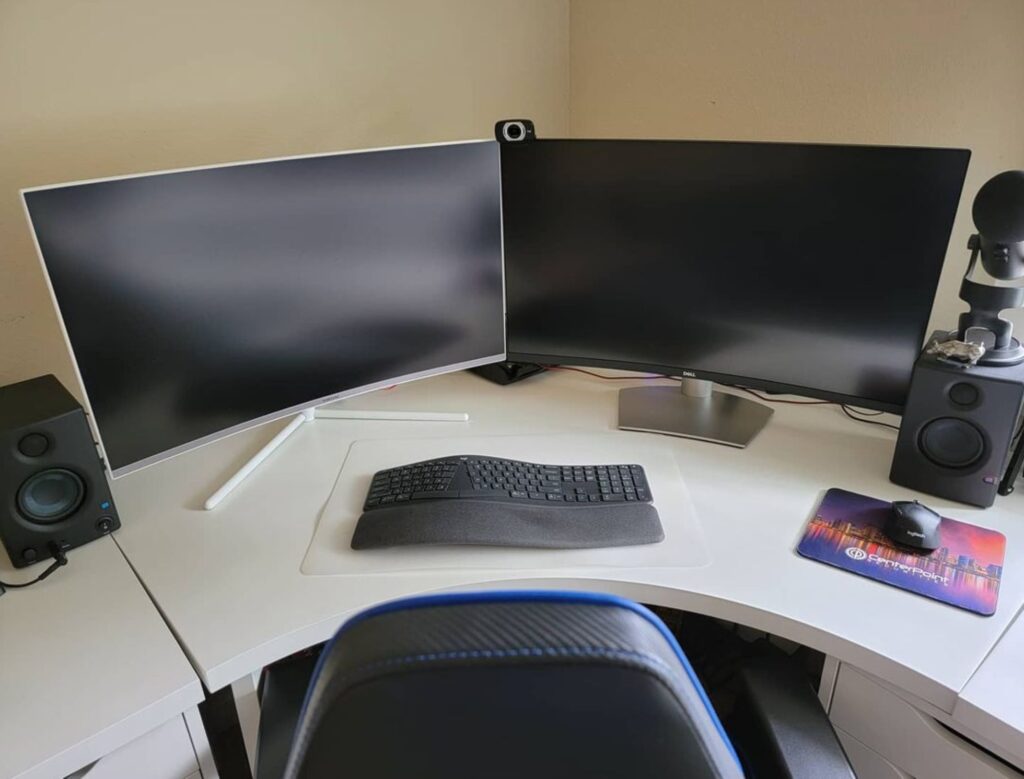
Dell XPS 8940
11th Gen Intel i7-11700 @ 2.5 GHz
48 GB RAM
NVIDIA GeForce RTX 3060 Ti
500GB SSD
1 TB HD
Dell wireless mouse
Logi wireless Ergo K860 keyboard
Dell S3221QS curved 32 inch 4k monitor
Samsung U32R59x curved 32 inch 4k monitor
800 Mbps cable internet connection
What I like about this setup is it’s somewhat minimalist (I don’t have the 8+ screens that some traders have, which I find to be overwhelming) but still gives me the screen space I need.
It’s also a good setup for 3d rendering/visual effects which I like to do as an occasional hobby.
Trading Tools I Use
Every trader has tools they use for their trading. These are all the trading tools I use. While none of them will turn you from an unprofitable trader to a profitable one (you need to put in the work to do that), they can give you the tools to help work on your edge and also find potential setups.
Thinkorswim Desktop and Mobile App
I’ve been using Thinkorswim desktop platform as my main charting and level 1 quote platform since around 2008. In fact, around 2008-2011 I used Thinkorswim as one of my brokers, as I liked to short stocks back then like I do now, and they had good borrows at the time. I no longer use them as a broker, but I keep $50 in there just to keep the account open so that I can continue to use the ThinkDesktop platform.
The ThinkDesktop platform is highly customizable, and I’ve always preferred the color schemes and look and feel compared to other charting platforms. There is a HUGE inventory of studies and indicators. There is also the ThinkScript language which allows you to create your own custom indicators. While I don’t trade options much other than the occasional basic put option, I’ve heard their options tools are excellent. Finally, I make heavy use of their OnDemand feature, which lets you go back and replay any trading day for any ticker up to several years ago. It’s been huge for me for backtesting purposes.
The biggest problem with the ThinkDesktop platform is that it can be a memory hog. However, it’s not an issue for me as I’ve got 48 GB RAM on my desktop computer. There’s also been a few instances in the past where the charts would lag near the open during highly volatile market days, although I haven’t experienced that issue for the past few years, so it appears that maybe they’ve corrected it.
I also use the Thinkorswim mobile app for watching stocks when I’m away from my desktop computer.
Scanz

I use Scanz for my real-time premarket and regular hours scanning. There are a huge number of ways you can develop your own custom scans. I use it to find gappers and also stocks trading on unusual volume. I also use it for price and news alerts. It’s also a great tool to do a quick lookup of characteristics of a stock like market cap or float, although at times I’ve found the float information to be inaccurate.
Trade Ideas

Trade Ideas is another real-time market scanner I use. I mainly use it to find stocks forming flags on high volume, or stocks on my watchlist forming flags. It’s very powerful and customizable. Trade Ideas is very powerful in the sense that you can scan in real time for intraday chart patterns (like breakouts from consolidation). The biggest limitation is that it can be pricey. As a trader, the monthly fees of some of the tools you use can add up.
Stockfetcher

I’ve been using Stockfetcher since I first started trading back around 2008. It’s always been my primary end-of-day scanning tool for generating watchlists for the next day. You can create your own custom scans to help find the best opportunities that fit your trading strategies. It’s also extremely inexpensive (only $25 per quarter).
Dilution Tracker

Dilution Tracker is my number one tool for assessing the risk of a stock offering. It’s also my primary tool for determining a stock’s market cap and float, as it’s the most accurate for that since it has the most up-to-date information on those statistics.
FinViz

FinViz is a free website where you can do basic scans or look at basic details of individual stocks (market cap, float, EPS, institutional holdings, etc). I like to use FinViz as an additional tool for examining details like institutional holdings.
Edgewonk

Edgewonk is an excellent trading journal that I use to assess the effectiveness of my trading strategies. You can create your own customizable statistics (for example, I track the float of the stocks I trade), and it can generate many useful stats to help you refine your trading edge. It’s one of the most detailed journals out there. The downfall is, since you can track so much detail of your trades, journaling can be somewhat tedious. However, if you want to be a really good trader, the tediousness can pay off. It does have the capability of importing trades from certain brokers to help you save time, although personally I manually enter all my trades.
TradePerformance
TradePerformance is an old Windows-based trading journal that I’ve been using since 2012 or so. The product is no longer available and you can’t download anything from there anymore, but I still have the old downloadable executable and still use it for journaling since I have journals in it dating back to 2012. It doesn’t give the same level of stat detail like Edgewonk, but it’s a nice quick journal for me to use for continuity from previous years and in conjunction with Edgewonk.
InvestorsUnderground

IU is one of the best trading chat rooms that I have experience with. I’m basically a “legacy member” and was there before they were called IU. They started as an old chat room called “Green on the Screen” run by an old trader named Muddy who has since passed away. They teamed up with Nate Michaud, who had a site called InvestorsLive at the time, and formed IU. While I don’t rely on their alerts (I’m a self-sufficient trader), I sometimes lurk in chat just as an additional source of info. Nate is an excellent trader and offers great insights to the stocks that are being traded, which are often some of the same ones I’m trading. Some of the things I learned in that chat are things I still use to this day. For example, Muddy was a big fan of using 10/60 moving average crosses as potential entry signals. I still use that as a potential signal for certain setups to this day.
Excel
I used plain ol’ Excel for strategy development and evaluation. I have hundreds of spreadsheets dating back to 2012 where I’ve tested and refined a variety of trading strategies that have helped me become the trader I am today. In fact, check out my article here where I give an example of how I will use Excel for strategy development.
Disclosure: I am an affiliate for InvestorsUnderground, Scanz, Trade Ideas, and Edgewonk, and receive a commission for people who sign up through links on my site. However, these are tools that I regularly use myself and would not be an affiliate if I did not use them.
Basic Strategy Evaluation
Any profitable trading strategy involves the following elements:
- Finding setups
- Entry criteria
- Stop loss placement
- Position sizing
- Exit strategies/profit taking
- A statistical edge that ensures a positive expectancy (a positive average profit per trade) over time
This article will focus on the very last element…ensuring your strategy is profitable over a reasonable sample of trades.
So how do you do this? It’s fairly simple, and all you need is a basic Excel spreadsheet.
A Basic Excel Spreadsheet for Strategy Evaluation
Click here to download an Excel spreadsheet that gives an example of how I’ve evaluated a real short trading strategy that I use. The spreadsheet shows real prices, with real entries and exits. Some of them are backtested trades (trades I didn’t take, but rather backtested the concept), and some are trades I have taken as part of continuing to evaluate and use the strategy in real time. I’ve changed the dates, tickers, and entry times so that you can’t reverse engineer my strategy…I’m not going to give away my edge! But you can use the basic format for evaluating your own strategies.
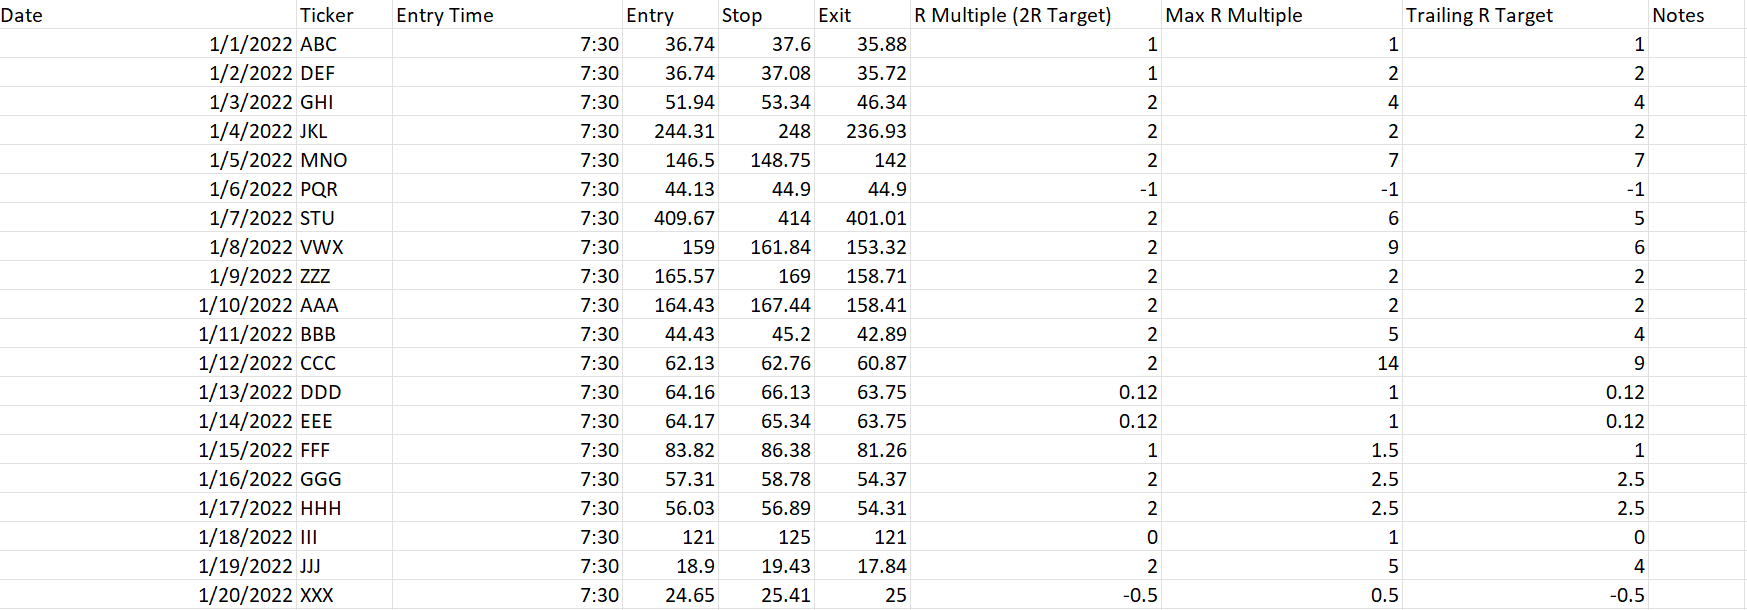
The columns of the spreadsheet are fairly simple:
- Date. The date the trade is taken
- Ticker symbol.
- Entry time. The time of day the trade is entered
- Entry price
- Stop loss price
- Exit price if I have a 2R target, with moving my stop to even when up 1R. An R multiple is your profit or loss relative to what you risked losing. If you enter a long trade at $100, with a stop loss at $90, then you’re risking $10 per share. If you exit the trade at $110, then you made 1 times the money you risked or +1R. If you exit the trade at $120, then you made +2R. If you exit the trade at $90, it’s -1R. If you don’t obey your stop loss and exit the trade at $80, it’s -2R. If you exit the trade at $100, it’s a break-even trade or 0R.
- R-Multiple for the trade if I have a 2R target. In this spreadsheet, I show the outcome of the trade if I plan on exiting at 2R. You can see many, but not all, hit the 2R target. Some only hit around 1R and thus I exit around there if it gets close to the end of the trading day. Some never even get 1R and end up being a loser (-1R). Some end up a scratch trade (0R) as I like to move my stop to break even once I’m up 1R. You can see I’ve kept the R multiples mostly at round integers for simplicity.
- The maximum R-multiple I could get out of the trade based on how low the stock goes. This just gives an idea of the max profit that could be made on the trade if you could pick the approximate bottom (which is impossible). It’s mainly used to assess the potential of the strategy, and to evaluate any profit taking strategies to see if I’m leaving too much money on the table (understanding I can never pick a bottom) and perhaps might need a better profit taking strategy.
- R-multiple for the trade if I use an R-based trailing stop. An R-based trailing stop involves moving my profit target up by 1R for each 1R the trade moves in my favor. For example, if I short a stock at $100 with a $110 stop, and the trade hits $90, I’m up 1R so I move my stop to break even at $100. If the trade hits $80 so I’m up 2R, then I move my stop to $90 to guarantee at least a 1R profit if the trade moves back against me. If the trade hits $70 so I’m up 3R, then I’ll move my stop to $80 to guarantee at least a 2R profit.
- Notes. This is just to keep some basic notes to evaluate certain details of the strategy.
So how do you know if the strategy is profitable? It’s simple…add up the R Multiple column. It should be a positive number. In this case, over a sample of 20 trades, the total R multiple is 25.74. This means the strategy, in aggregate, made 25.74 times the money risked. That’s really good. The average R multiple per trade is 1.3, which means I expect to make 1.3 times the money I risk on average per trade in this strategy.
You can see it’s even better using an R-based trailer rather than a predetermined 2R profit taking point. The aggregate R-multiple is 52.74!!!!! I make twice as much money by simply using an R-based trailer and letting my winners run. The average R multiple (the expectancy) is 2.6!!!!
Now, this is a very profitable strategy but it doesn’t provide opportunities every day or even every week. Most strategies you evaluate won’t be nearly this good in terms of the average expectancy. This is more an illustration of how you can use a basic Excel spreadsheet to evaluate a trading strategy over time. The bottom line is your total R multiple over a reasonable sample of trades should be positive, and the more positive it is, the better. You can also use this to test out different profit taking or stop loss strategies to see if you can improve the average R multiple.
So what’s a reasonable sample of trades? It’s really tough to say, and will vary on the strategy. The bigger the sample, the better. If you can automate your backtesting, it’s even better because you can do large samples in a short period of time. Unfortunately, my strategies involve some discretionary elements, so I can’t automate backtesting. This means I have to manually go back and test my strategies by loading up intraday historical charts using Thinkorswim‘s OnDemand feature. It’s VERY tedious to do this, and can take several hours of work to collect sufficient data on a strategy. To try to reduce my workload, I try to sample trades from different times with different market conditions. For example, the markets were very bearish in early 2020 due to COVID, then the markets became uber bullish, especially early 2021 when even the worst trash was flying. Now, in early 2022, the markets have turned bearish again, with the smallcap market being nearly dead. Thus, when I test a strategy, I try to take samples of days from early 2020, mid 2020, early 2021, mid 2021, and this year so that I can cover a variety of market conditions. If your strategy has several high R-multiple (3-6 or more) trades like my example does, then likely you don’t need as big of a sample as even a losing streak of several -1R trades won’t be enough to ruin the profitability of the strategy. For example, even though this sample is only 20 trades, it spans several time points from 2020 to early 2022, and has several high R multiple trades, so I’m confident in its ability despite 20 trades being a small sample. If I had a lower average R multiple per trade, I’d want a bigger sample to ensure a statistical edge and profitability over time.
So how big should your expectancy be? Keep in mind that when you backtest, your results will always be better than they’ll be in real time, due to factors such as slippage, fees, or unforseen circumstances that your backtest doesn’t catch. Thus, if your average R-multiple for a backtest is fairly small, then it’s probably not going to be a profitable strategy in real time. For example, if you backtest and find your expectancy is 0.25R per trade, it’s probably not going to be an effective strategy even though your backtest says it’s mathematically profitable. Personally I like to see my backtested results to be close to an average of 1R per trade or better, as I know that, in real time, it will probably be closer to 0.5 to 0.75 as I trade the strategy over time.
I have over 100 spreadsheets like this where I’ve evaluated strategies over the years. And the variables in the example spreadsheet aren’t the only things I’ll look at. For example, when testing smallcap strategies, I’ll track things like float since they may have a potential impact on the profitability of the strategy. For example, after very thorough testing, I have certain rules I’ve developed around very low float stocks, such as the timing of taking short positions on them.
Prepare, Perform, Profit
Trading is not easy. It takes a lot of study and hard work. Strategy evaluation is just one component of being a successful trader. Excel isn’t the only way to evaluate strategies, but it’s one way I’ve done it in the past and I continue to use it, despite also using more advanced journals now like Edgewonk. Hope this basic spreadsheet can help you in your evaluation of your own trading strategies!
February 2022 Month In Review
In my January review, I told you how the smallcap market was dead and I made very few trades. The smallcap market continued to be dead for most of February. Thus, I decided to adapt and I worked hard on some largecap strategies. However, this time I wasn’t going to make the same mistakes as last year and try out new strategies before they were thoroughly tested. I spent several hours working on some new strategies, and took a lot of time backtesting them before I put real money at risk.
It paid off. I finished with a more profitable month than January, In fact, all my profits came from largecaps. The few smallcap trades I made ended up being losers. Here’s the stats from Edgewonk.
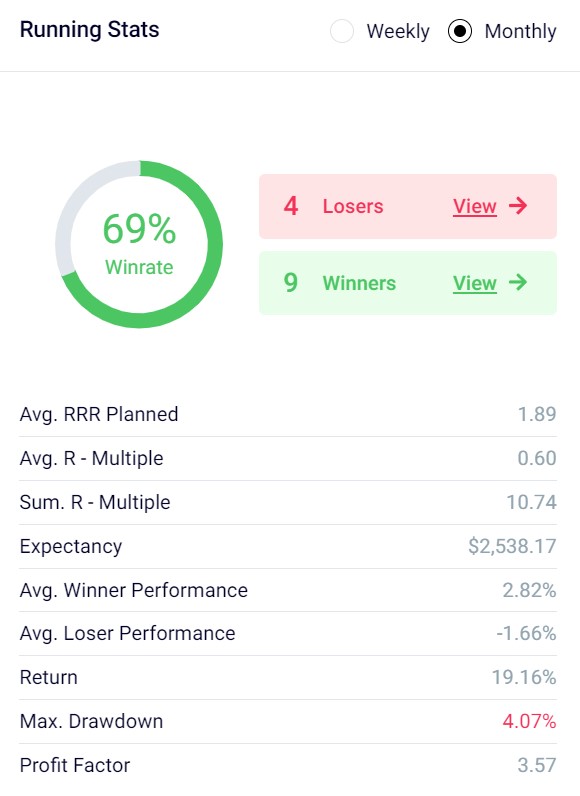
Similar to January, I took very few trades, but I made them count. I ended up with a +10.74R profit (meaning I made 10.74x the money I risked), and a 19.16% realized return on my capital. Also, unlike January, I had some multi-R winners.
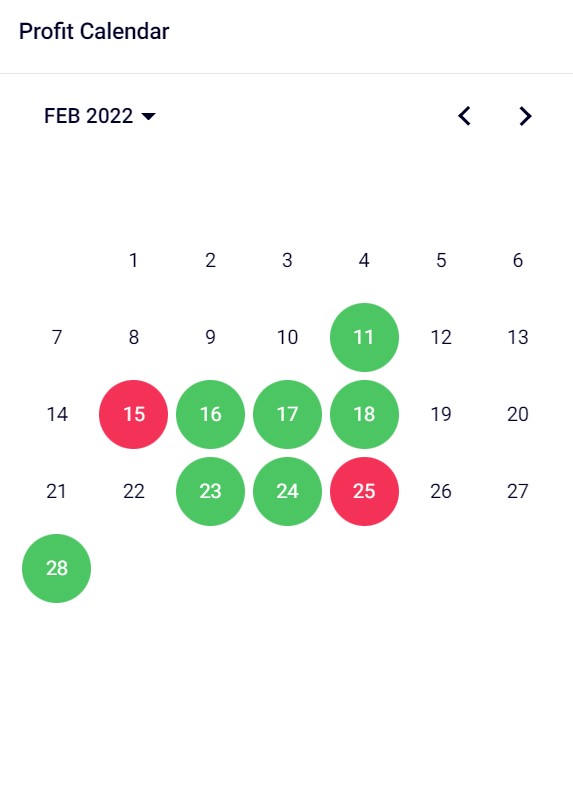
Similar to January, I didn’t make trades every day. I had 9 days I closed trades on, with most of them being green.
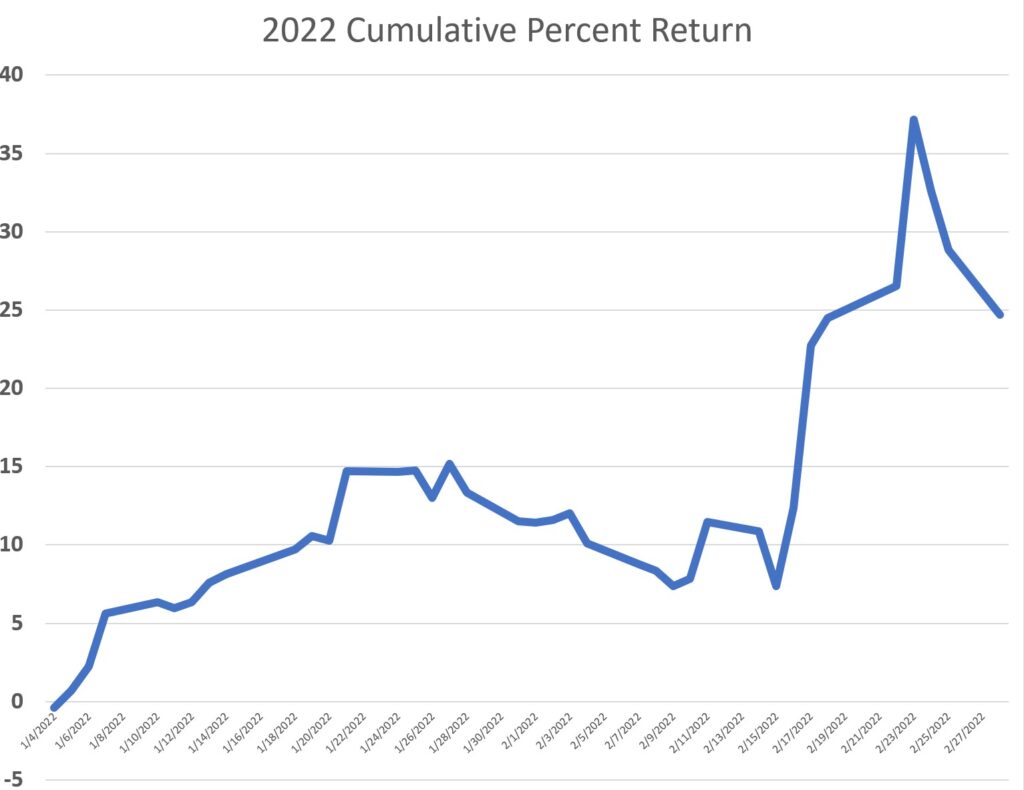
My return in February, including long-term positions that are not closed out, finished at +11.8%. In contrast, SPX hade a -3.1% return for the month. My YTD cumulative return now stands at 24.7%, whereas SPX is -8.8%. Here’s a YTD graph. The drawdown the past 3 days is mainly due to some unrealized changes in the value of some long-term short positions I have (due to the huge spike in the markets the past 3 days).
I’m hoping now that, with some of the newer largecap strategies I’ve developed, along with my repertoire of smallcap strategies, that I’ll have a variety of strategies to draw on in March for many more green days and bigger returns. The wildcard will be my long-term short positions, which are mainly focused on the crypto markets.