
Any profitable trading strategy involves the following elements:
- Finding setups
- Entry criteria
- Stop loss placement
- Position sizing
- Exit strategies/profit taking
- A statistical edge that ensures a positive expectancy (a positive average profit per trade) over time
This article will focus on the very last element…ensuring your strategy is profitable over a reasonable sample of trades.
So how do you do this? It’s fairly simple, and all you need is a basic Excel spreadsheet.
A Basic Excel Spreadsheet for Strategy Evaluation
Click here to download an Excel spreadsheet that gives an example of how I’ve evaluated a real short trading strategy that I use. The spreadsheet shows real prices, with real entries and exits. Some of them are backtested trades (trades I didn’t take, but rather backtested the concept), and some are trades I have taken as part of continuing to evaluate and use the strategy in real time. I’ve changed the dates, tickers, and entry times so that you can’t reverse engineer my strategy…I’m not going to give away my edge! But you can use the basic format for evaluating your own strategies.
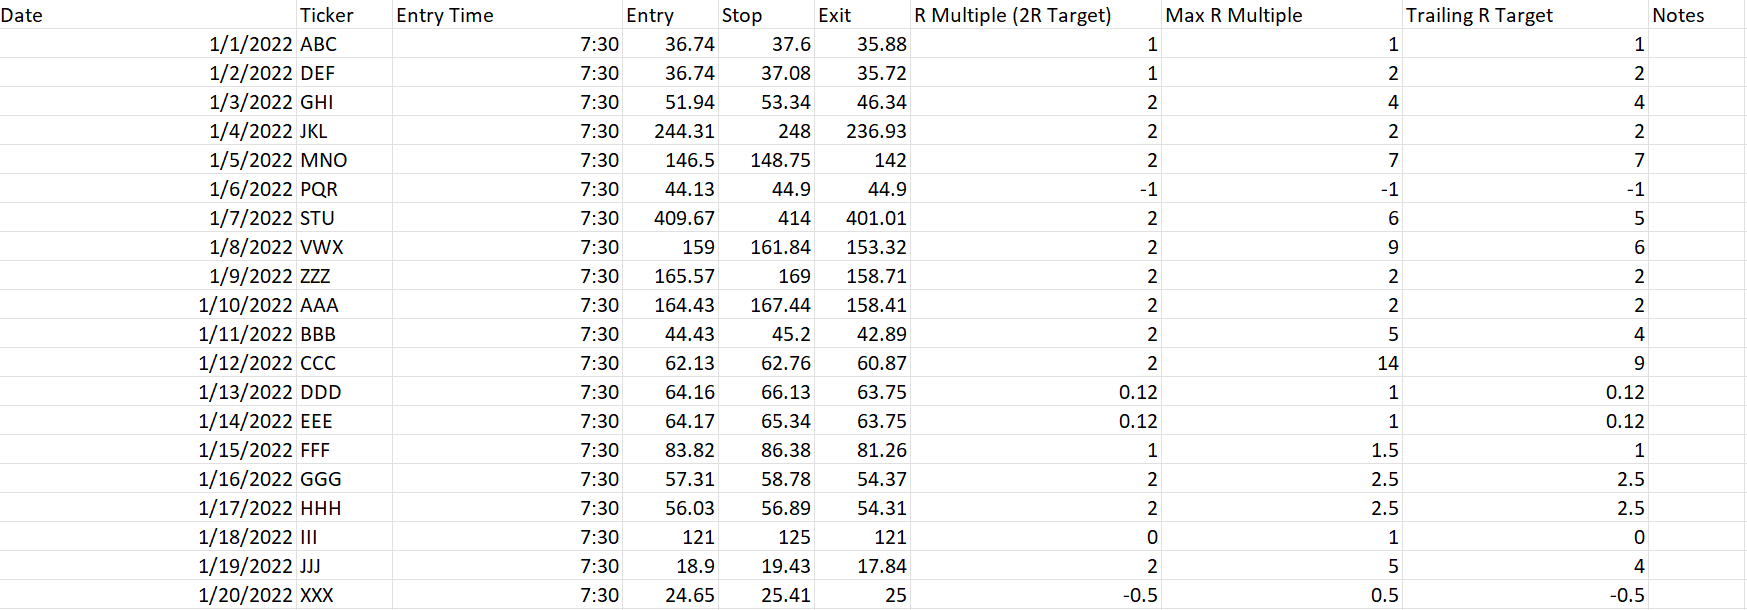
The columns of the spreadsheet are fairly simple:
- Date. The date the trade is taken
- Ticker symbol.
- Entry time. The time of day the trade is entered
- Entry price
- Stop loss price
- Exit price if I have a 2R target, with moving my stop to even when up 1R. An R multiple is your profit or loss relative to what you risked losing. If you enter a long trade at $100, with a stop loss at $90, then you’re risking $10 per share. If you exit the trade at $110, then you made 1 times the money you risked or +1R. If you exit the trade at $120, then you made +2R. If you exit the trade at $90, it’s -1R. If you don’t obey your stop loss and exit the trade at $80, it’s -2R. If you exit the trade at $100, it’s a break-even trade or 0R.
- R-Multiple for the trade if I have a 2R target. In this spreadsheet, I show the outcome of the trade if I plan on exiting at 2R. You can see many, but not all, hit the 2R target. Some only hit around 1R and thus I exit around there if it gets close to the end of the trading day. Some never even get 1R and end up being a loser (-1R). Some end up a scratch trade (0R) as I like to move my stop to break even once I’m up 1R. You can see I’ve kept the R multiples mostly at round integers for simplicity.
- The maximum R-multiple I could get out of the trade based on how low the stock goes. This just gives an idea of the max profit that could be made on the trade if you could pick the approximate bottom (which is impossible). It’s mainly used to assess the potential of the strategy, and to evaluate any profit taking strategies to see if I’m leaving too much money on the table (understanding I can never pick a bottom) and perhaps might need a better profit taking strategy.
- R-multiple for the trade if I use an R-based trailing stop. An R-based trailing stop involves moving my profit target up by 1R for each 1R the trade moves in my favor. For example, if I short a stock at $100 with a $110 stop, and the trade hits $90, I’m up 1R so I move my stop to break even at $100. If the trade hits $80 so I’m up 2R, then I move my stop to $90 to guarantee at least a 1R profit if the trade moves back against me. If the trade hits $70 so I’m up 3R, then I’ll move my stop to $80 to guarantee at least a 2R profit.
- Notes. This is just to keep some basic notes to evaluate certain details of the strategy.
So how do you know if the strategy is profitable? It’s simple…add up the R Multiple column. It should be a positive number. In this case, over a sample of 20 trades, the total R multiple is 25.74. This means the strategy, in aggregate, made 25.74 times the money risked. That’s really good. The average R multiple per trade is 1.3, which means I expect to make 1.3 times the money I risk on average per trade in this strategy.
You can see it’s even better using an R-based trailer rather than a predetermined 2R profit taking point. The aggregate R-multiple is 52.74!!!!! I make twice as much money by simply using an R-based trailer and letting my winners run. The average R multiple (the expectancy) is 2.6!!!!
Now, this is a very profitable strategy but it doesn’t provide opportunities every day or even every week. Most strategies you evaluate won’t be nearly this good in terms of the average expectancy. This is more an illustration of how you can use a basic Excel spreadsheet to evaluate a trading strategy over time. The bottom line is your total R multiple over a reasonable sample of trades should be positive, and the more positive it is, the better. You can also use this to test out different profit taking or stop loss strategies to see if you can improve the average R multiple.
So what’s a reasonable sample of trades? It’s really tough to say, and will vary on the strategy. The bigger the sample, the better. If you can automate your backtesting, it’s even better because you can do large samples in a short period of time. Unfortunately, my strategies involve some discretionary elements, so I can’t automate backtesting. This means I have to manually go back and test my strategies by loading up intraday historical charts using Thinkorswim‘s OnDemand feature. It’s VERY tedious to do this, and can take several hours of work to collect sufficient data on a strategy. To try to reduce my workload, I try to sample trades from different times with different market conditions. For example, the markets were very bearish in early 2020 due to COVID, then the markets became uber bullish, especially early 2021 when even the worst trash was flying. Now, in early 2022, the markets have turned bearish again, with the smallcap market being nearly dead. Thus, when I test a strategy, I try to take samples of days from early 2020, mid 2020, early 2021, mid 2021, and this year so that I can cover a variety of market conditions. If your strategy has several high R-multiple (3-6 or more) trades like my example does, then likely you don’t need as big of a sample as even a losing streak of several -1R trades won’t be enough to ruin the profitability of the strategy. For example, even though this sample is only 20 trades, it spans several time points from 2020 to early 2022, and has several high R multiple trades, so I’m confident in its ability despite 20 trades being a small sample. If I had a lower average R multiple per trade, I’d want a bigger sample to ensure a statistical edge and profitability over time.
So how big should your expectancy be? Keep in mind that when you backtest, your results will always be better than they’ll be in real time, due to factors such as slippage, fees, or unforseen circumstances that your backtest doesn’t catch. Thus, if your average R-multiple for a backtest is fairly small, then it’s probably not going to be a profitable strategy in real time. For example, if you backtest and find your expectancy is 0.25R per trade, it’s probably not going to be an effective strategy even though your backtest says it’s mathematically profitable. Personally I like to see my backtested results to be close to an average of 1R per trade or better, as I know that, in real time, it will probably be closer to 0.5 to 0.75 as I trade the strategy over time.
I have over 100 spreadsheets like this where I’ve evaluated strategies over the years. And the variables in the example spreadsheet aren’t the only things I’ll look at. For example, when testing smallcap strategies, I’ll track things like float since they may have a potential impact on the profitability of the strategy. For example, after very thorough testing, I have certain rules I’ve developed around very low float stocks, such as the timing of taking short positions on them.
Prepare, Perform, Profit
Trading is not easy. It takes a lot of study and hard work. Strategy evaluation is just one component of being a successful trader. Excel isn’t the only way to evaluate strategies, but it’s one way I’ve done it in the past and I continue to use it, despite also using more advanced journals now like Edgewonk. Hope this basic spreadsheet can help you in your evaluation of your own trading strategies!


[…] refined a variety of trading strategies that have helped me become the trader I am today. In fact, check out my article here where I give an example of how I will use Excel for strategy […]